CCS ships six distinct debug surfaces that complement each other rather than duplicate. Understanding what each one covers helps you reach for the right tool instead of hunting through them all.
| Tool | How to activate | Best for |
|---|---|---|
showdebug camera |
Console: showdebug camera |
Quick pose check; color-coded HUD that fires everywhere DisplayDebug runs |
| Debug Panel | Console: CCS.Debug.Panel 1 |
Always-on live readout — sparklines, tree glyph rendering, inline warnings |
| Viewport Debug | Console: CCS.Debug.Viewport 1 |
3D in-world gizmos — frustum, per-node overlays visible during F8 eject |
| Rewind Debugger | Unreal Rewind Debugger recording/playback | Historical camera pose and CCS gizmo playback while scrubbing a recorded PIE session |
| Dump Commands | Console: CCS.Dump.Stack / .Tree / .Camera |
One-shot text snapshots to Output Log + clipboard; ideal for bug reports and diffing |
| Runtime Previewer | Camera Type Asset Editor: Window -> Runtime Previewer | Live PIE pawn/camera relationship in a docked editor viewport |
| Runtime Graph Inspector | Camera Type Asset Editor: Window -> Runtime Debug or hover graph nodes during PIE | Per-node runtime values, output pins, and pose-after-node directly in the editor graph |
All runtime debug surfaces read from the same runtime state — snapshots produced by BuildDebugSnapshot on the context stack, director, and evaluation tree. They stay in lockstep automatically.
None of this costs anything in Shipping builds. The Debug Panel, Viewport Debug, Rewind trace writers, Dump Commands, and editor-only Runtime Previewer are all gated away from Shipping builds. showdebug camera routes through DisplayDebug, which Unreal strips in Shipping by default.
Runtime Previewer
The Runtime Previewer is a dock tab inside the Camera Type Asset editor. Open it from Window -> Runtime Previewer while editing a camera type asset, start PIE, then use the editor toolbar's Debug picker to bind a matching runtime camera instance.
The previewer keeps the controlled pawn fixed around the preview origin and draws the live game camera as a pawn-relative marker with a frustum, movement arrow, FOV, context name, and status text. It is meant for debugging camera-to-character spatial relationships: whether the boom is drifting, whether a lock-on camera sits where you expect relative to the pawn, and whether the runtime view matches the graph debug data.
Mouse input inside the Runtime Previewer controls only the tab's observer viewport. It never moves the PIE pawn, never drives the runtime camera, and does not change the camera evaluation result. When a skeletal pawn is available, the preview scene mirrors the live skeletal pose into an editor-only proxy; otherwise it falls back to a simple pawn marker and still draws camera relation data when possible.
Runtime Graph Inspector
The Camera Type Asset editor can inspect a live runtime instance of the asset while PIE is running. Use the editor toolbar's Debug picker to bind a runtime camera, then open Window -> Runtime Debug or hover a node in the graph.
The graph overlay marks active and idle nodes, shows the pose captured immediately after each node tick, and exposes current runtime parameter values. Output pins are read from the running camera's runtime data block. Parameters that are owned by an active modifier show the modifier-applied value, because modifier overrides intentionally outrank graph wires and exposed parameters.
The Runtime Debug panel focuses the selected live node and can be opened from the node hover card. Pinned cards stay open after the cursor leaves the node, so you can compare node values while scrubbing or changing gameplay state.
Debug Panel (CCS.Debug.Panel)
CCS.Debug.Panel 1      ← enable
CCS.Debug.Panel 0      ← disable
The Debug Panel is a 2D HUD overlay rendered via UDebugDrawService's "Game" channel. It updates every frame and can be toggled without leaving PIE — it persists across camera transitions and context switches so you can watch the tree evolve in real time.
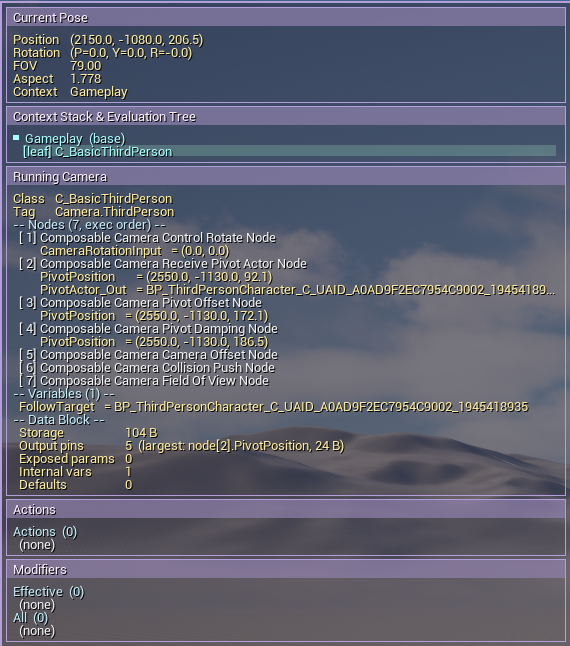
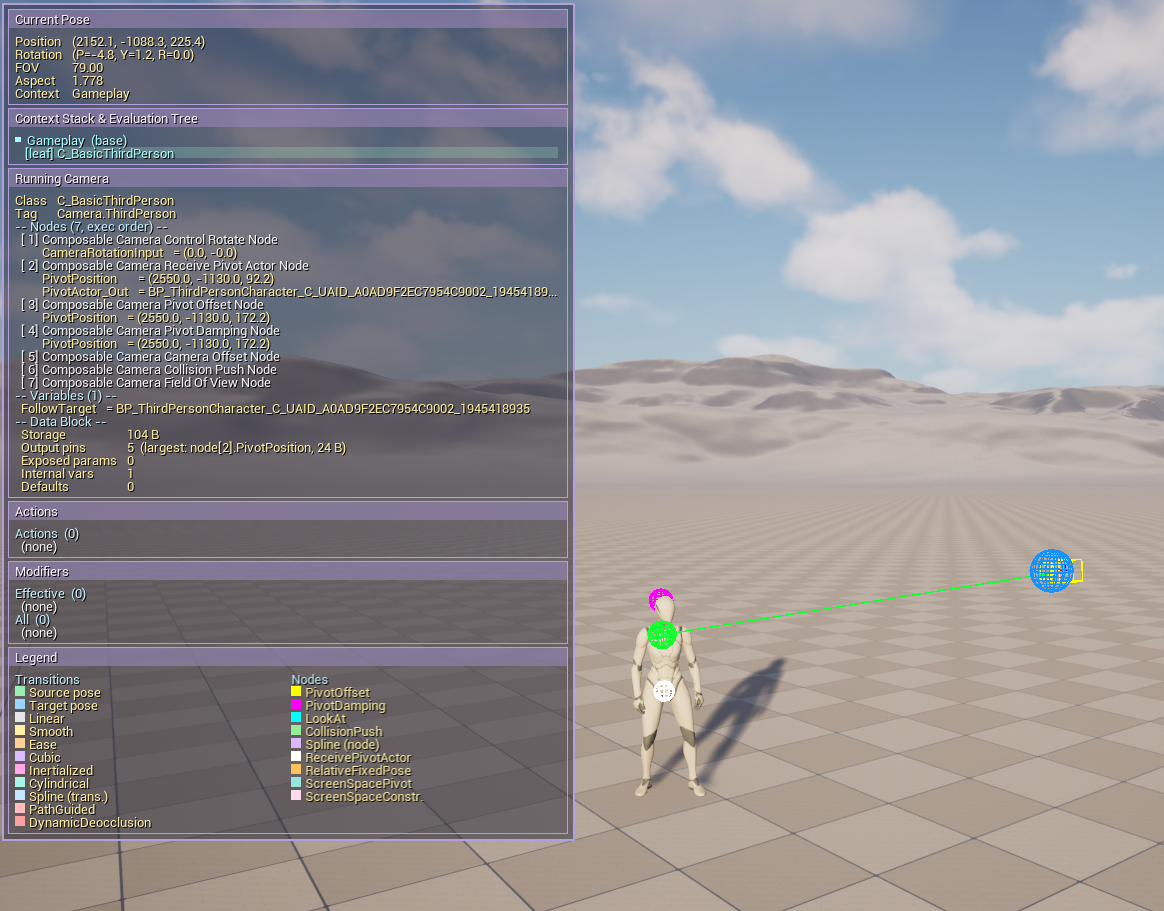
The panel is organized into five regions, top to bottom.
Current Pose — the PCM's final output this frame: world position, rotation, FOV, and aspect ratio. Below the numbers, a pose-history sparkline covers the last two seconds of frames. Context-switch moments appear as vertical lines wherever the active context changed. In editor builds, hovering over the sparkline shows a tooltip with the exact values at that history point.
Context Stack & Evaluation Tree — a live tree rendering of the entire context stack. Each director's evaluation tree is expanded inline using box-drawing glyphs (└─, ├─, │). Tree nodes are labeled by kind — [Leaf], [RefLeaf], [Transition] — with the camera or transition class name. For in-progress transitions, the row also shows a percentage and elapsed/total seconds, plus a small blend-weight sparkline with 25 samples so you can see whether the curve is linear, eased, or something more complex. The dominant leaf (the one that would remain if all transitions collapsed immediately) is visually distinguished. Reference leaves inline their referenced subtree in a dimmer color, so you can see both sides of a cross-context blend without switching screens.
Running Camera — the active context's running camera in full: class name, camera tag, transient lifetime if applicable, every node in execution order with its resolved output-pin values, every exposed parameter's runtime value, every internal variable's value, and a data-block memory summary (bytes, pin count, parameter count, variable count). This is the richest single-screen view of what a camera is actually computing this frame.
Camera Actions — a flat list of currently active actions on the PCM, showing each action's class name and scope (camera-scoped vs persistent).
Modifiers — a count summary of active modifiers. The full per-modifier listing with priority resolution lives in showdebug camera's All Modifiers and Effective Modifiers sections.
Warnings — any Warning or Error emitted by LogComposableCameraSystem or LogComposableCameraSystemEditor appears here in amber or red, with an elapsed-time label ("2s ago") and a repeat badge ("×4") when the same message fires multiple times. This surfaces silent runtime errors — a spline transition missing its rail actor, a referenced director destroyed mid-blend — that would otherwise require an open Output Log window to notice. The ring buffer holds the 16 most recent distinct entries; older entries are evicted from the front.
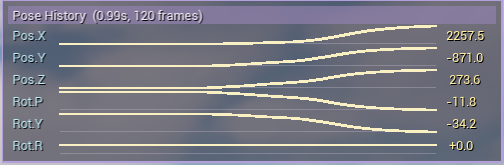
There is also a CCS.Debug.Panel.PoseHistory command to preview camera pose history. This only includes camera rotation and position. This can be quite useful if you want to detect when and where the camera pops or jitters.
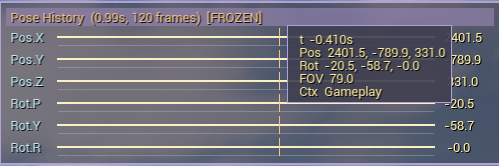
Use CCS.Debug.Panel.PoseHistory.Freeze to freeze the history panel, and then press F8 or Shift+F1 to display the mouse the hover above graph. It will show you the concrete information of the camera pose at that timestamp.
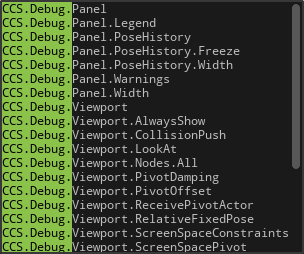
Viewport Debug (CCS.Debug.Viewport)
CCS.Debug.Viewport 1                      ← master switch
CCS.Debug.Viewport 0                      ← off
CCS.Debug.Viewport.AlwaysShow 1           ← force frustum even while possessing
CCS.Debug.Viewport.Nodes.All 1           ← enable all node gizmos at once
CCS.Debug.Viewport.Transitions.All 1     ← enable all transition gizmos at once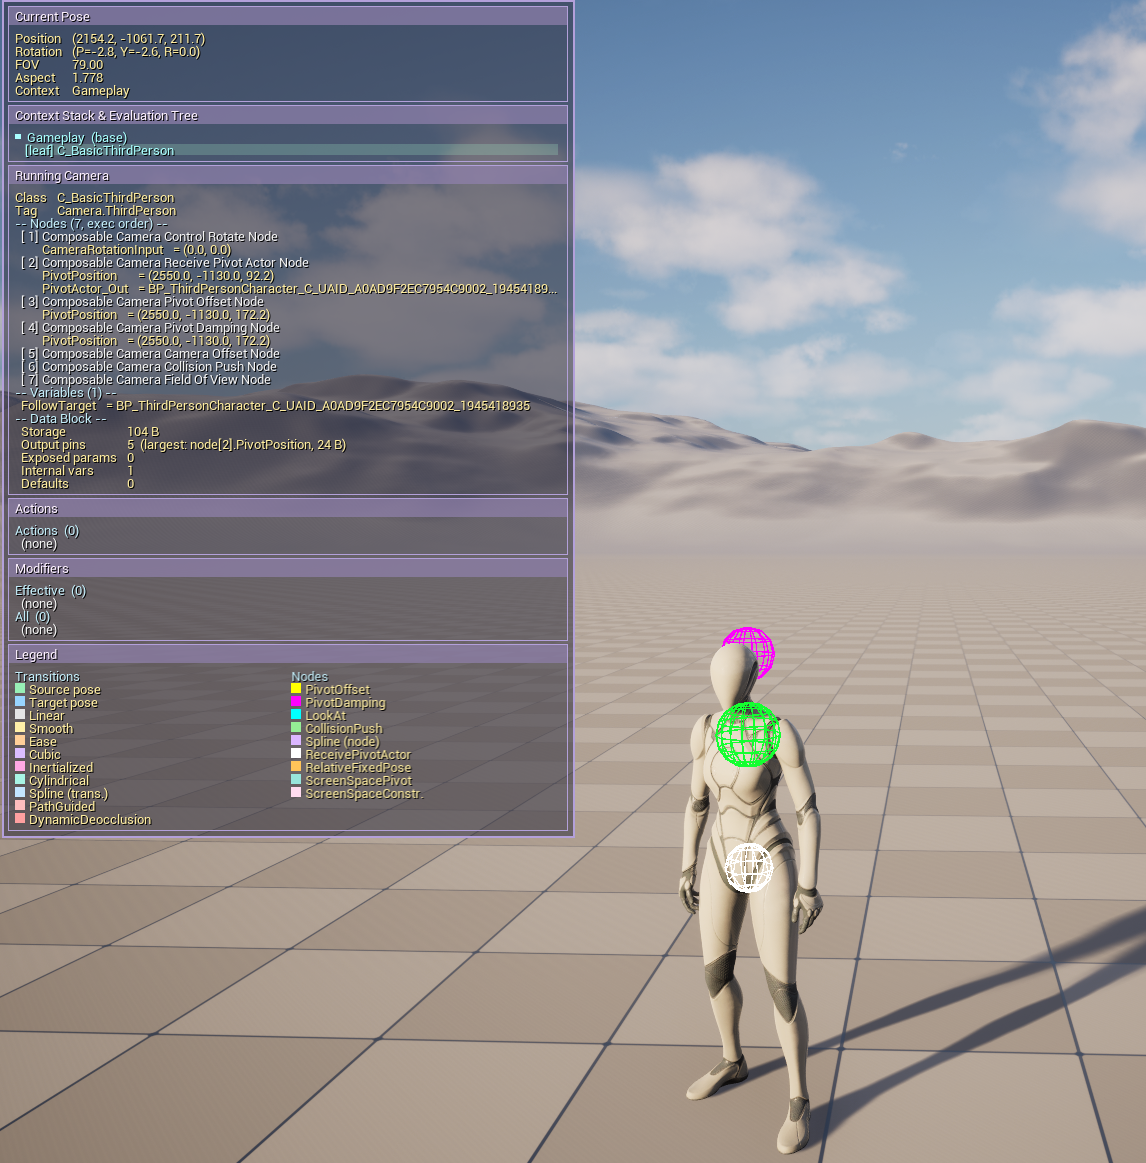
The Viewport Debug draws into the world's line batcher via an FTSTicker delegate rather than UDebugDrawService. This matters: UDebugDrawService's "Game" hook does not fire from the editor viewport during F8 eject, which is typically when 3D camera debug is most useful. The line batcher's output is rendered by every viewport that draws that world, so the gizmos appear both in the game viewport during possessed play and in the editor viewport during F8 eject or Simulate mode.
The master switch (CCS.Debug.Viewport 1) enables frustum drawing. The frustum auto-hides while you are possessing the camera, because the near-plane frustum occludes the scene from the camera's own viewpoint. It only fires when bIsSimulatingInEditor is true, i.e. during F8 eject or Simulate mode. CCS.Debug.Viewport.AlwaysShow 1 overrides this — useful in multi-viewport setups where a secondary viewport shows the camera from outside while you possess it.
Per-node gizmos are controlled individually:
| CVar | Node | What it draws |
|---|---|---|
CCS.Debug.Viewport.PivotOffset 1 |
PivotOffsetNode |
Pivot point and offset arm from pivot to camera |
CCS.Debug.Viewport.LookAt 1 |
LookAtNode |
Look-at target position and direction ray |
CCS.Debug.Viewport.CollisionPush 1 |
CollisionPushNode |
Trace rays and the pushed camera position |
CCS.Debug.Viewport.Spline 1 |
SplineNode |
The resolved spline path drawn in world space |
CCS.Debug.Viewport.PivotDamping 1 |
PivotDampingNode |
Raw (undamped) and damped pivot positions side by side |
CCS.Debug.Viewport.PivotLookAhead 1 |
PivotLookAheadNode |
Predicted pivot after velocity look-ahead |
CCS.Debug.Viewport.LockOnAimPoint 1 |
LockOnAimPointNode |
Stable virtual aim point for lock-on target framing |
Per-transition gizmos are controlled separately:
| CVar | Transition | What it draws |
|---|---|---|
CCS.Debug.Viewport.Transitions.CompositionPreserving 1 |
CompositionPreservingTransition |
Standard source/target/progress markers plus a line from the source endpoint to the tracked subject |
Each per-node CVar defaults to 0 so a camera with multiple active nodes doesn't turn into an unreadable tangle. Enable them one at a time to isolate the node you're investigating. CCS.Debug.Viewport.Nodes.All 1 enables all node gizmos that are relevant to the current running camera — a good first overview without legend rows for node types that are not in that camera.
When the Debug Panel legend is visible, its node rows are filtered against the current running camera's node classes and its transition rows are filtered against active transitions in the current evaluation tree. CCS.Debug.Viewport.Nodes.All 1 and CCS.Debug.Viewport.Transitions.All 1 therefore mean "show all relevant rows for this frame," not "show every color in the global debug palette."
All gizmos use SDPG_Foreground depth priority and translucent-wireframe spheres, so they render in front of scene geometry and remain readable even when the camera is embedded inside a character mesh.
If you are writing a custom node and want to add your own gizmo, override DrawNodeDebug(FComposableCameraDebugDrawSink&, bool) on your node class (guarded #if !UE_BUILD_SHIPPING), declare a static TAutoConsoleVariable<int32> under CCS.Debug.Viewport.<YourNodeName>, early-out on it, and emit primitives through the draw sink. See the Viewport Debug header for the full recipe.
Rewind Debugger
In editor builds, CCS integrates with Unreal's Rewind Debugger so recorded PIE sessions can replay camera debug state while you scrub time. Start a Rewind recording, exercise a gameplay or Level Sequence CCS camera, stop recording, then select the controlled character or relevant actor in Rewind Debugger.
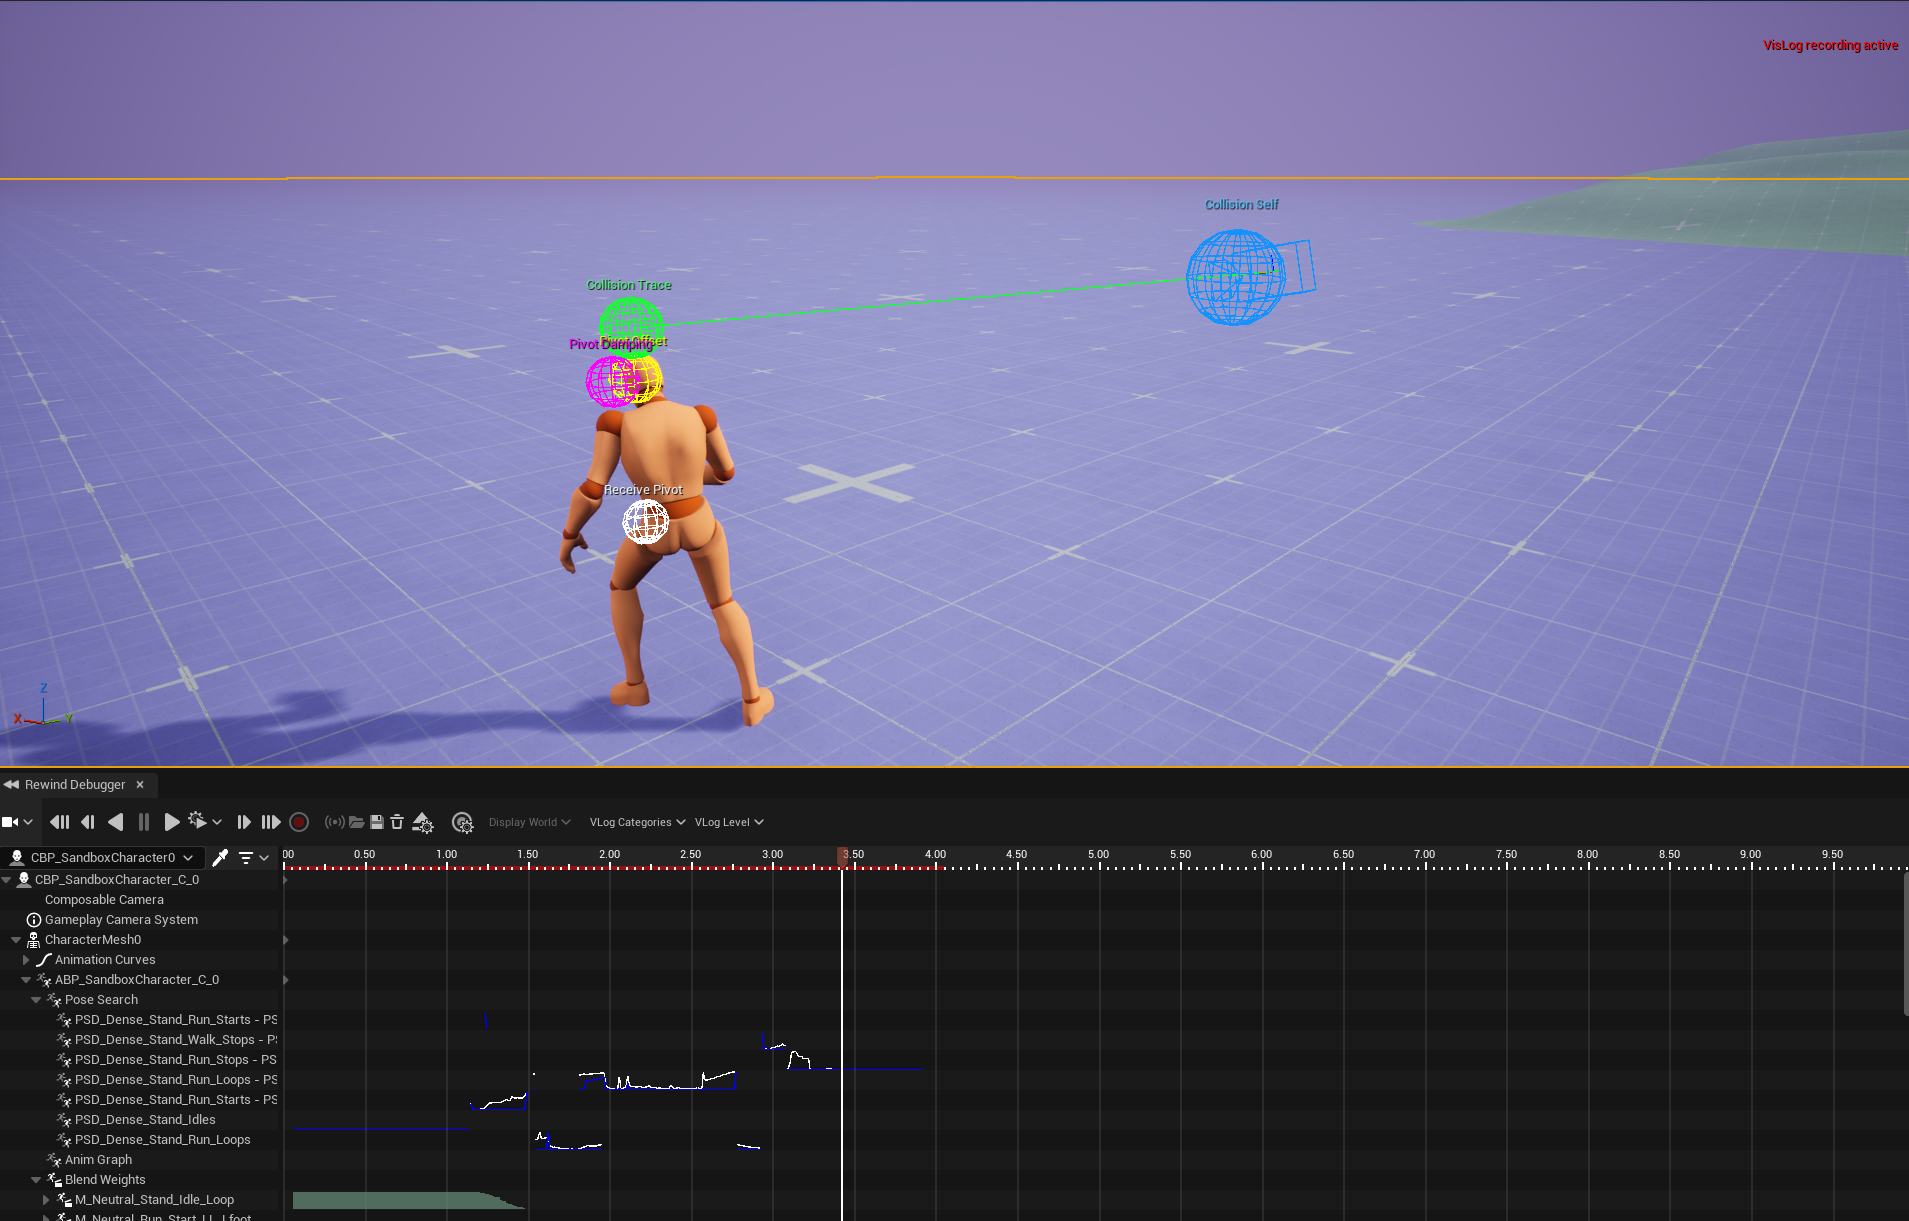
During recording, the editor extension enables the ComposableCameraSystemChannel trace channel. CCS writes an active-camera frame for the rendered camera pose and a CCS evaluation frame for the camera type asset, context name, internal CCS pose, and captured node/transition primitives. Gameplay cameras emit from the player camera manager path; Level Sequence cameras emit from the UComposableCameraLevelSequenceComponent path.
During playback, the Rewind extension matches the selected actor's active-camera frame with the nearest compatible CCS evaluation frame. The historical view draws the compact camera frustum plus captured CCS gizmos and short sphere labels, even if the live viewport gizmo CVars were off during recording. Capture intentionally forces all 3D node and transition gizmos through the trace draw sink; live viewport drawing still obeys CCS.Debug.Viewport.* CVars.
Use Rewind Debugger when a camera pop, bad transition marker, or Sequencer projection problem only appears for a few frames and is hard to inspect live. Use Viewport Debug when you only need the current frame and want direct CVar control.
Dump Commands (CCS.Dump)
Dump commands produce a formatted plain-text snapshot. The text goes simultaneously to LogComposableCameraSystem at Display verbosity (so it appears in Output Log without raising the log verbosity) and to the system clipboard. They capture state at a single point in time — ideal for bug reports and for diffing before/after states when fixing a regression.
CCS.Dump.Stack
Dumps the full context stack: live depth, each context's name, its running camera name, its last evaluated pose (position, rotation, FOV), and the flattened evaluation tree. Pending-destroy contexts appear at the end, labelled [pending]. This is the same information the Debug Panel's "Context Stack & Evaluation Tree" region shows, formatted as indented plain text.
CCS.Dump.Tree
Dumps the active context's evaluation tree only — the running camera, the last pose, and each flattened tree node with its transition progress and elapsed/total time. Useful when only the active context matters and the full-stack output from CCS.Dump.Stack would add noise.
CCS.Dump.Camera [tag]
Without an argument, dumps the active context's running camera in full: class name, camera tag, pose, transient lifetime if applicable, every node in execution order with each output pin's resolved runtime value, every exposed parameter and internal variable with its value, and a data-block memory summary (bytes, pin count, parameter count, variable count).
With a tag argument, scans every live context's running camera for a case-insensitive match on CameraTag and dumps the first match:
CCS.Dump.Camera Gameplay.ThirdPerson.FollowThis lets you dump a suspended source camera that is currently the source side of a blend — you can ask for it by tag without making it the active context's running camera first.
Both forms copy the result to the clipboard. Paste directly into a bug report or a diff tool.
Choosing the right tool
The surfaces are designed to be used together — there is no wrong answer. A typical debugging session might start with the Debug Panel (leave it on in your dev build; it costs nothing when the CVar is 0) to notice something is wrong, switch to Viewport Debug to see the spatial geometry of the problem, and finish with CCS.Dump.Camera to copy a precise snapshot into a bug report.
showdebug camera remains the right choice for quick one-off checks in contexts where you don't want the always-on panel, or in a packaged Development build where a second viewport is impractical. It draws from the same data sources as the panel, so the two never disagree.
See also
- ShowDebug reference — full section-by-section breakdown of the
showdebug cameraoverlay - Debug Panel & Dump Commands reference — complete CVar table, output format details, and build-gating notes
- Profiling & Performance — using these tools alongside Unreal Insights for timing analysis
- Custom Nodes → Adding a gizmo — how to implement
DrawNodeDebugon a new node class