Camera evaluation runs every frame on the game thread, so even small inefficiencies compound quickly — especially on mobile or when blending multiple cameras simultaneously. This page covers how to measure camera cost, where to look for bottlenecks, and how to keep the system within budget.
The budget
A useful starting point: the entire camera pipeline (context stack evaluation → tree walk → node chain → transition blend → action ticks → modifier resolution) should complete in under 50 µs on your target platform for a single active camera. Blending two cameras roughly doubles that. Three simultaneous transitions (rapid-fire activations during gameplay) roughly triple it.
These numbers are a guideline, not a hard limit — your project's overall frame budget determines what you can afford.
Quick checks before profiling
Before reaching for heavyweight tools, try these:
Debug overlay tools
CCS ships several complementary overlays for quick state inspection — none of which require stopping PIE or opening Unreal Insights. They share the same data source, so they are interchangeable for the questions below; pick the one that fits your workflow.
showdebug camera (see reference) toggles a color-coded HUD overlay anchored to the top-left of the viewport. It shows the active camera's node chain, context stack, and modifier state but does not give timing numbers.
CCS.Debug.Panel 1 (see Debug Panel reference) enables a richer always-on overlay in the top-right: a live tree rendering of the entire context stack with blend-weight sparklines, per-pin output values for every node, and a warnings region that surfaces silent runtime errors without an open Output Log. Recommended as a persistent companion during development — it costs nothing when the CVar is 0.
Both overlays will immediately answer:
- How many nodes are in the active camera's chain? More nodes = more per-frame cost.
- Is a transition still running? Active transitions evaluate both source and target trees — double the node count.
- Are there stuck reference leaves? A
pending destroycontext that didn't collapse means an extra director is evaluating every frame. - How many actions are active? Each action ticks once per frame.
stat game
Unreal's built-in stat game shows the game thread's per-frame breakdown. Look for the CameraSystem or PlayerCameraManager rows — these capture the PCM's DoUpdateCamera cost. If the camera row is a small fraction of the total frame, you probably don't have a camera performance problem.
stat CCS
stat CCSThis command activates STATGROUP_CCS, the plugin's own stat group. Unlike stat game (which gives a single camera row), stat CCS breaks the per-frame cost into individual subsystem counters so you can pinpoint which layer is expensive without opening Unreal Insights.
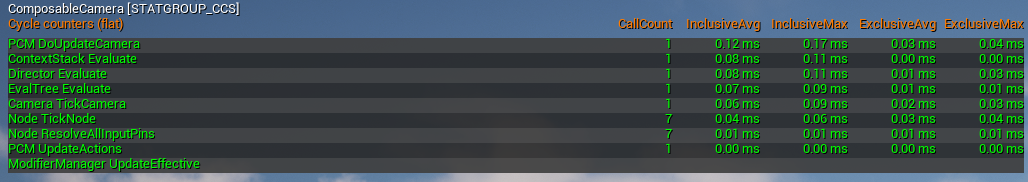
| Counter | What it measures |
|---|---|
PCM DoUpdateCamera |
Total cost of the PCM's per-frame update — the envelope for everything below |
PCM UpdateActions |
Tick loop over all active camera actions |
ContextStack Evaluate |
Tier 1 stack walk — normally near-zero unless a context is being pushed or popped this frame |
Director Evaluate |
Per-director evaluation (one director per live context) |
EvalTree Evaluate |
Full evaluation tree walk for the active director |
EvalTree InnerNode Evaluate |
Per-inner-node cost during a live transition (repeats once per in-progress blend) |
Camera TickCamera |
Per-camera node chain evaluation — usually the dominant cost |
Node TickNode |
Individual node tick, nested under Camera TickCamera |
Node ResolveAllInputPins |
Pin resolution pass that runs before each node tick |
Transition Evaluate |
Blend evaluation for an active transition |
ModifierManager UpdateEffective |
Modifier priority resolution (runs once per frame per PCM, not per camera) |
A typical steady-state frame shows Camera TickCamera as the tallest bar. During a transition, EvalTree InnerNode Evaluate appears alongside it and Transition Evaluate shows the blend cost. If ModifierManager UpdateEffective is unusually high, you likely have a large number of registered modifiers forcing repeated priority sorting — review the modifier count via showdebug camera's All Modifiers section.
stat CCS uses the engine's standard stats infrastructure and is available in Debug, Development, and Test builds. It is compiled out in Shipping (STATGROUP_CCS is declared under STATCAT_Advanced, which the engine excludes from Shipping stat groups).
Unreal Insights
For detailed per-function timing, Unreal Insights is the tool. The plugin's evaluation path is instrumented with standard UE trace markers, so it shows up in Insights without any plugin-side setup.
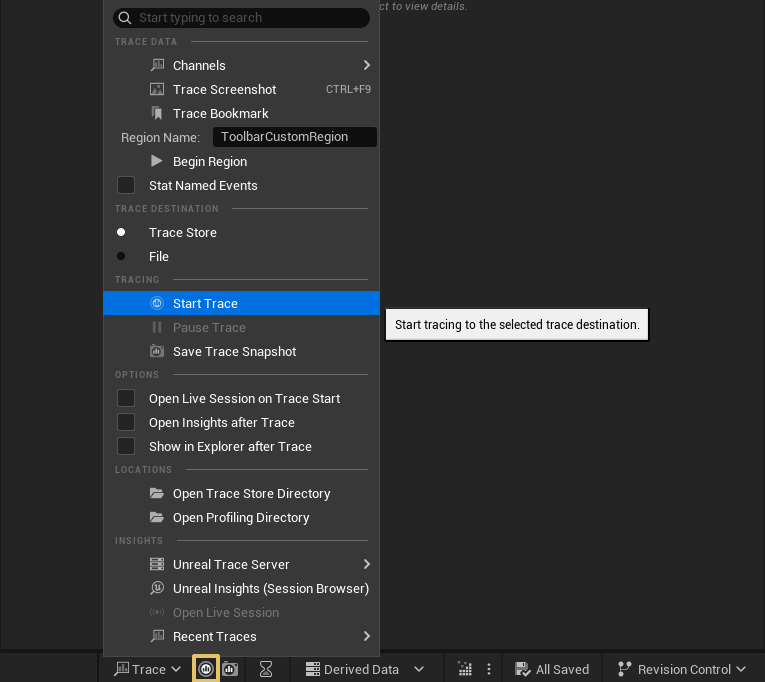
Recording a trace
- Launch PIE with
-trace=default,cpuon the command line, or enable tracing from Session Frontend → Profiler → Trace. - Play through the scenario you want to profile (camera activation, transition, rapid-fire switches).
- Stop tracing and open the
.utracefile in Unreal Insights (standalone app shipped with the engine).
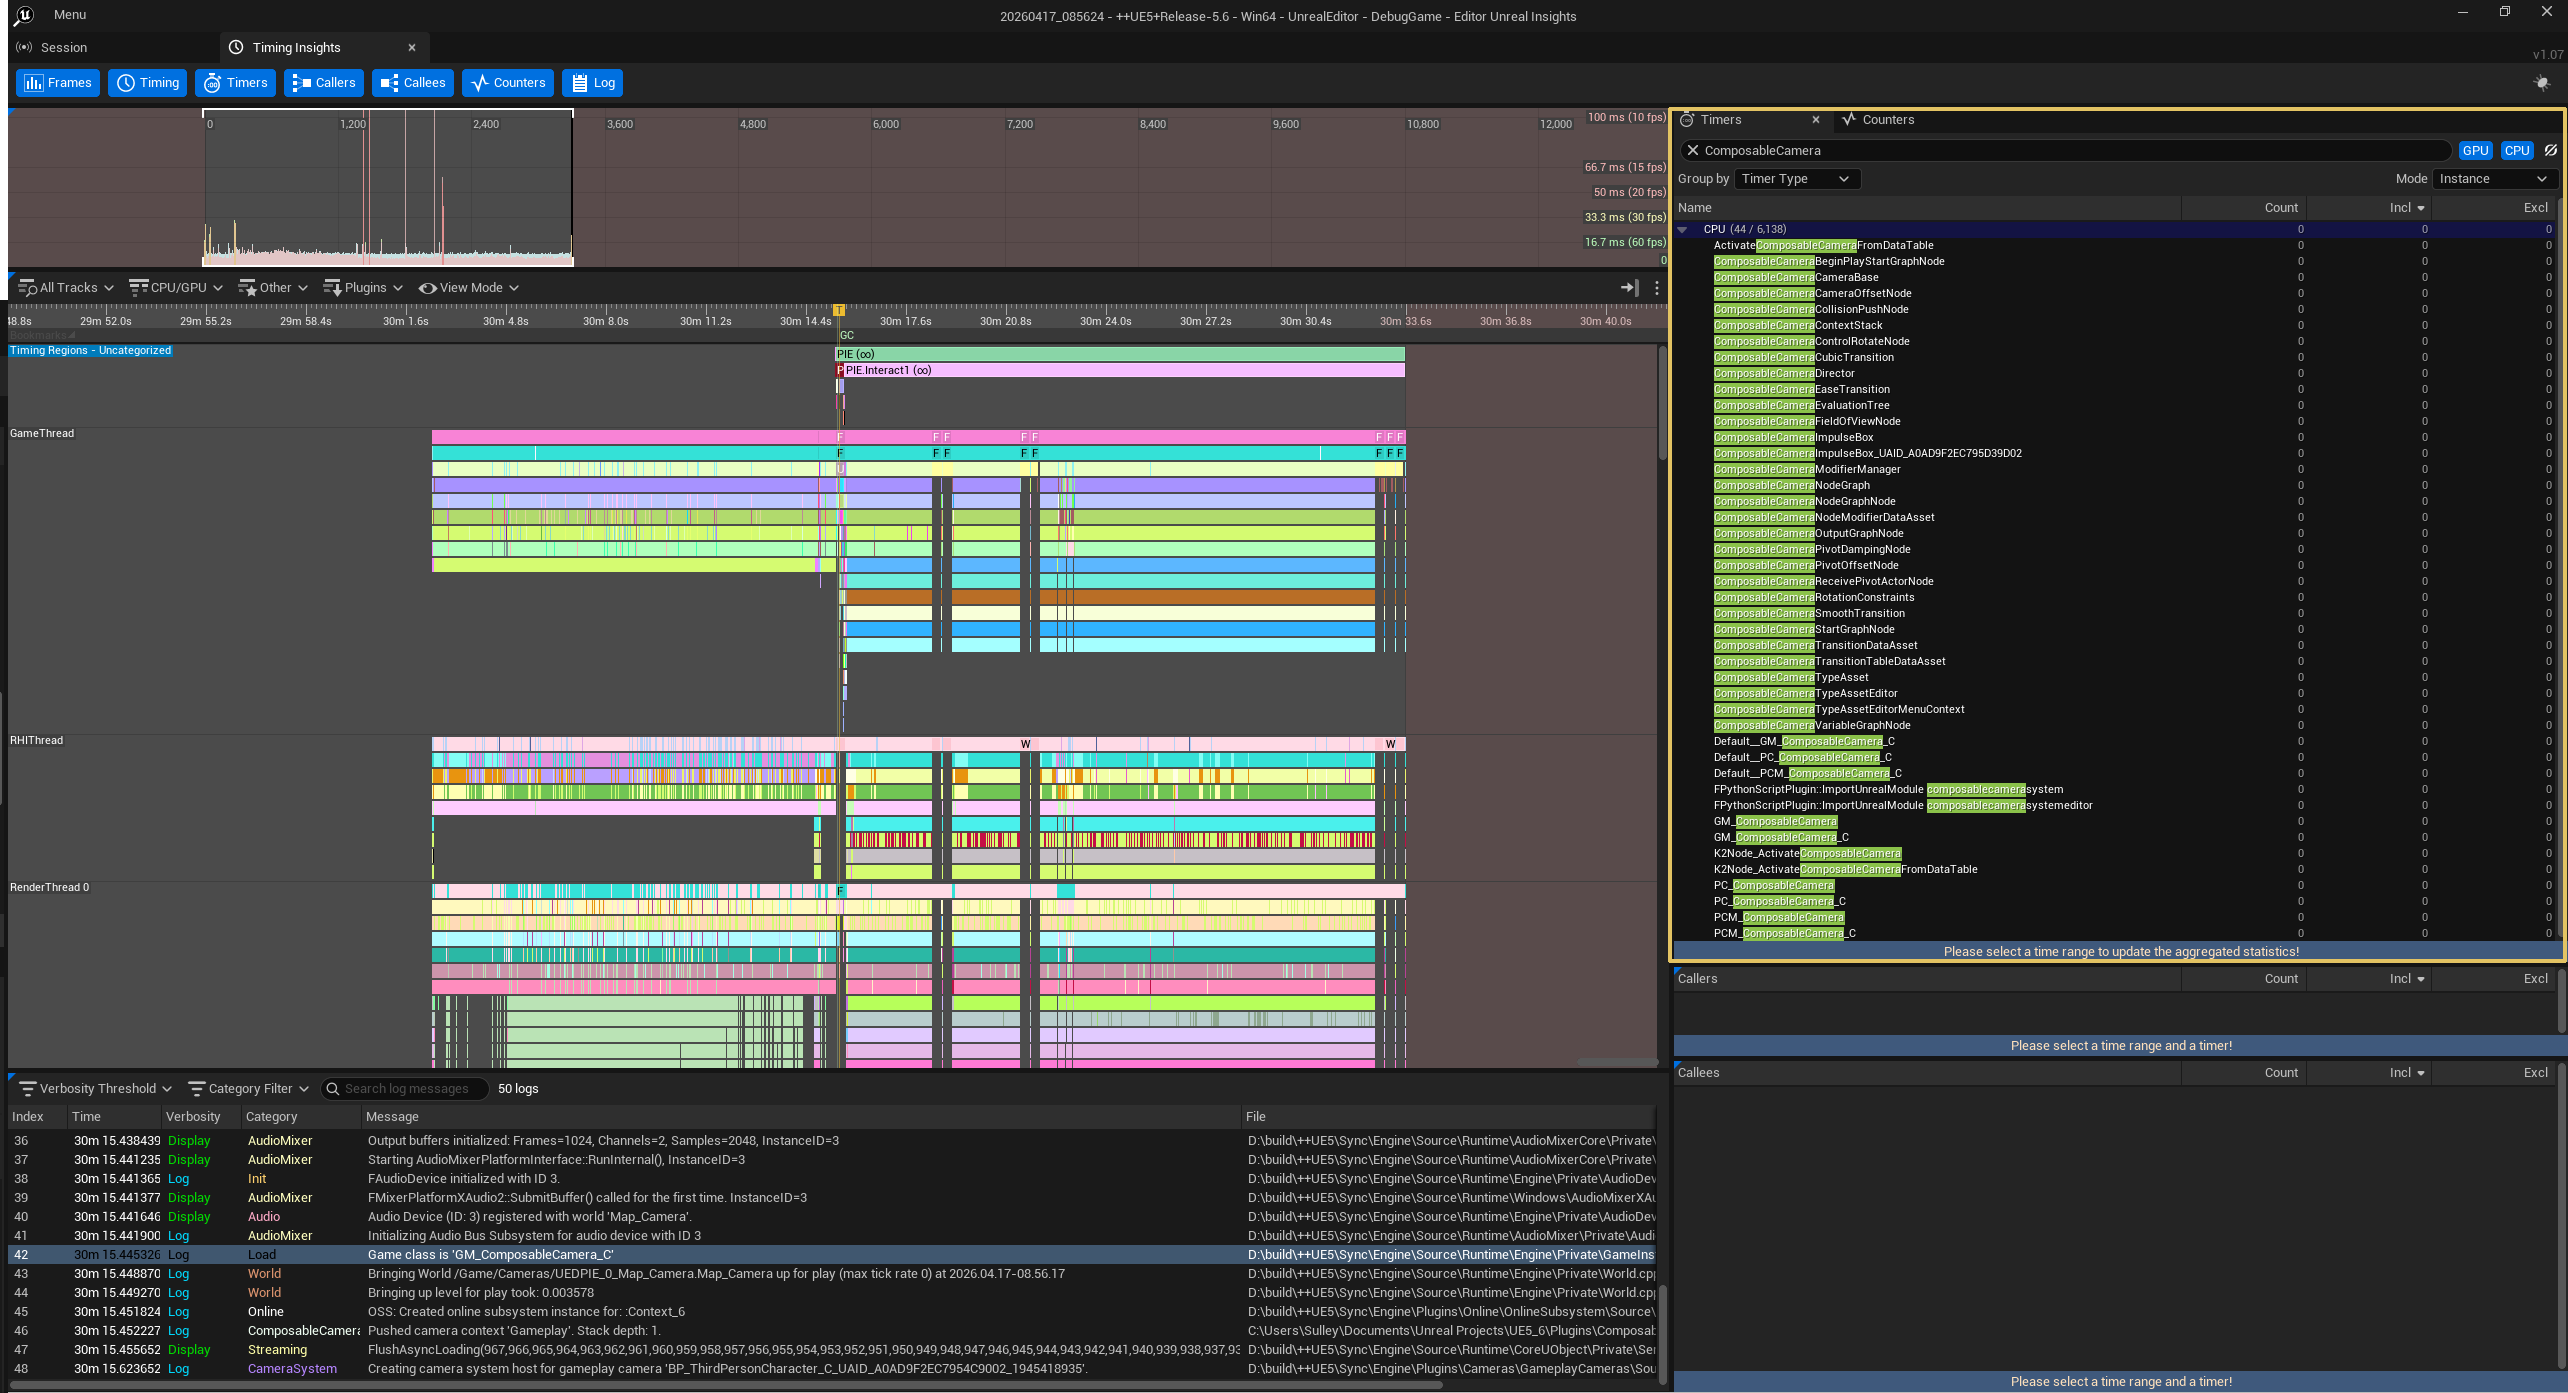
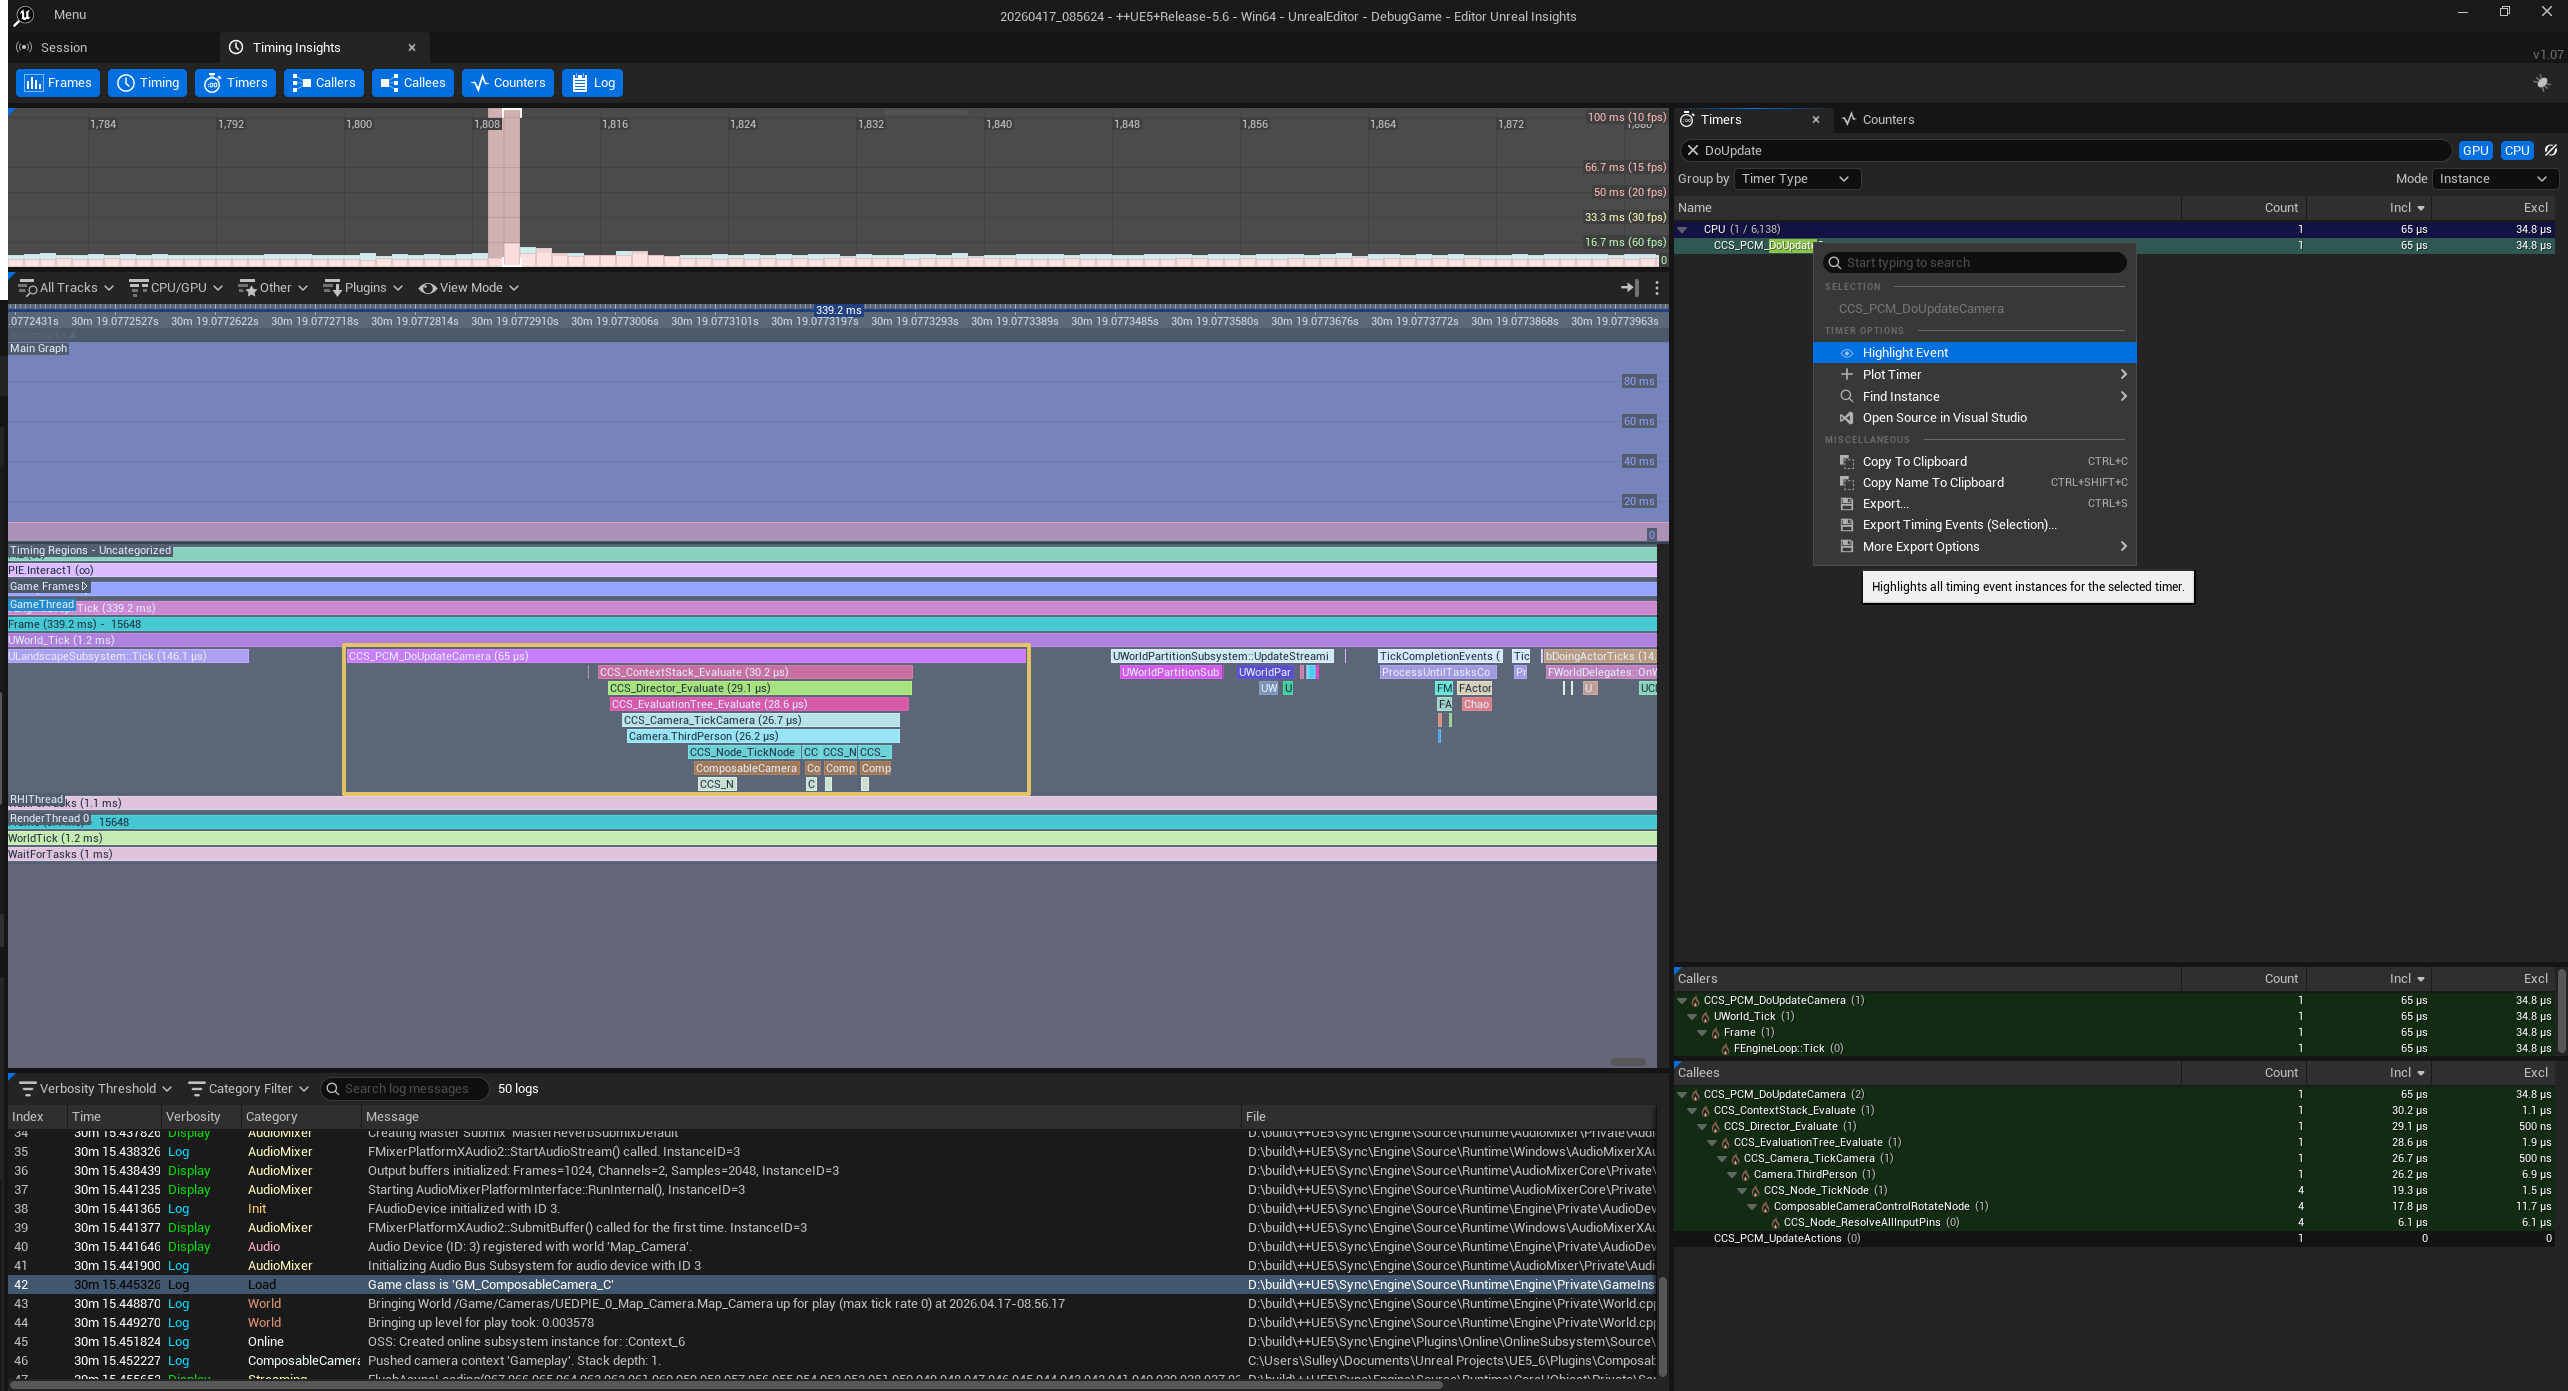
What to look for
In the Timing Insights view, filter by ComposableCamera or PlayerCameraManager to isolate camera-related scopes:
AComposableCameraPlayerCameraManager::DoUpdateCamera— the top-level scope. Everything else nests inside it.UComposableCameraContextStack::Evaluate— Tier 1. Should be near-zero unless a context is being pushed/popped this frame.UComposableCameraDirector::Evaluate→UComposableCameraEvaluationTree::Evaluate— Tier 2. The recursive tree walk.AComposableCameraCameraBase::TickCamera— per-camera node chain evaluation. This is usually the dominant cost.- Individual node ticks (
OnTickNode) — visible as child scopes underTickCamera. The most expensive shipped node is typicallyCollisionPushNode(line/sphere traces) followed byPivotDampingNode(spring math). - Transition
Evaluate— visible during active blends. Cost depends on the transition type; inertialized transitions are cheap (polynomial math), spline transitions are moderate (spline eval + possibly traces).
Reading the timeline
During steady-state gameplay (one camera, no transitions), you should see a thin, consistent DoUpdateCamera bar each frame. During a transition, the bar doubles in width because both source and target cameras evaluate. After CollapseFinishedTransitions fires, the bar should return to single-camera width.
If the bar stays wide after a transition should have finished, a transition is stuck or a reference leaf isn't collapsing — check showdebug camera or the Debug Panel's Context Stack region for a pending destroy entry that didn't clean up.
Common bottlenecks
Collision nodes
CollisionPushNode runs line traces and/or sphere sweeps every frame. On complex geometry, each trace can cost 2–10 µs. Two things to try:
- Reduce trace complexity. Use
Spheretrace type with a small radius rather than complex sweep shapes. SetTraceChanneltoCamera(which you can configure to ignore small props). - Reduce trace frequency. If the camera is relatively stable (e.g. no player input), skip traces when the delta from the last frame is below a threshold. This requires a custom node — the shipped
CollisionPushNodetraces every frame unconditionally.
Damping interpolators
PivotDampingNode and other damping nodes run spring-damper math each frame. The cost per instance is small (~1 µs), but cameras with multiple damping stages (pivot damping + rotation damping + offset damping) add up. Keep damping nodes to what's perceptually necessary.
Transition pile-ups
Rapid-fire camera activations during gameplay (e.g. quick weapon switching, rapid context pushes) create a chain of inner nodes in the evaluation tree. Each in-progress transition evaluates both its children. Three concurrent transitions mean six leaf evaluations per frame instead of one.
The system collapses finished transitions on the next frame, so this is self-healing — but during the pile-up, the cost spikes. If your gameplay triggers very frequent activations, consider whether a hard cut (no transition) is acceptable for rapid switches, reserving smooth transitions for deliberate camera changes.
Blueprint nodes on the hot path
BlueprintCameraNode ticks through the Blueprint VM, which is several times slower than an equivalent C++ node. For prototyping a single camera, it's fine. For shipping production code that runs on many cameras, port to C++. The Custom Nodes recipe is the cheapest migration path.
Allocations in the hot path
The hot-path rule prohibits allocations inside per-frame evaluation. Common offenders:
FString::PrintfinsideOnTickNode— even for logging.TArray::Addon a result buffer every frame — preallocate withSetNumUninitialized().NewObjectinside tick — cache the subobject inOnInitialize.- Implicit
FStringconstruction fromUE_LOGatVerboselevel — gate behindif (UE_LOG_ACTIVE(LogComposableCameraSystem, Verbose)).
To detect allocations, run Unreal Insights with the memory trace channel enabled and look for allocation events inside TickCamera scopes.
stat commands reference
These engine-level stat commands are useful alongside the plugin's own diagnostics:
| Command | What it shows |
|---|---|
stat game |
Per-frame game thread breakdown — find the camera row |
stat slow |
Anything over 1 ms — useful for spotting camera spikes during transitions |
stat unit |
Frame, game, draw, GPU times — confirms whether you're game-thread bound |
stat CCS |
CCS-specific per-subsystem counters — PCM, context stack, director, tree, camera, node, transition, modifier |
stat scenerendering |
Rendering cost — rules out GPU as the bottleneck |
Performance checklist
A quick list to run through before shipping:
- One camera, no transitions —
DoUpdateCameraunder 50 µs on target hardware. - During a transition — cost roughly doubles (two cameras evaluating). Confirm it returns to baseline after collapse.
- Rapid-fire activations — pile-up cost spikes but self-heals within a few frames. No stuck transitions in
showdebug cameraor the Debug Panel. - No allocations in tick — verify with Insights memory trace.
- No Blueprint nodes on the hot path in shipping builds — all prototyping
BlueprintCameraNodes ported to C++. - CollisionPushNode trace channel set to something cheaper than
Visibilityif scene complexity is high. - Mobile budget — re-profile on device; desktop numbers are not representative. Consider disabling self-collision or reducing trace frequency for mobile.
See also
showdebug camera— the in-game overlay for live state inspection- Debug Panel & Dump Commands — richer real-time overlay and clipboard dumps
- User Guide → Debugging — overview of all four debug surfaces and when to use each
- Custom Nodes → Hot-Path Rule — the allocation constraint and how to comply
- FAQ → Performance — common performance questions and answers